What Is Website Performance and Why It’s Important
Website performance refers to how quickly a website loads on a web browser. It also defines the quality of the website’s usability, interactivity, and reliability.
Web performance is often a visitor’s first assessment of your site. If a site loads quickly, the visitor can start interacting with it sooner, improving the user experience.
A well-performing website helps communicate and establish your brand image, which ultimately benefits your project or business. It can also improve the website’s ranking on search engine results pages.
This article will discuss website performance’s importance, affecting factors, and metrics.

What Is Website Performance?
Website performance refers to how fast a website loads and becomes interactable on browsers, strongly influencing visitors’ first impressions. Ensuring optimal website performance has various benefits, from improving user experience to boosting conversions and sales.
Why Is Website Performance Important?
Website performance defines your site’s accessibility and usability, significantly impacting your project or business. Here are the main reasons why maintaining your website performance is essential.
User Experience
Users expect websites to deliver what they want as quickly as possible. According to Google, more than half of all visitors abandon websites that take more than three seconds to load. So the longer it takes for websites to load, the more likely users will leave.
In other words, slow websites test visitors’ patience and create an unpleasant user experience. This makes visitors less likely to return, ultimately harming your business.
In contrast, visitors will have a pleasant user experience if they can interact with websites sooner. This quick fulfillment of their expectations leads to recurrent visits.
Visitor Retention
A study shows that 79% of visitors won’t revisit a website after being dissatisfied. A way to satisfy visitors is to improve your website’s performance.
A well-performing website loads quickly, providing a pleasant user experience for visitors. Such visitors are more likely to return, improving visitor retention.
Conversions and Sales
A study by Walmart shows that every one-second improvement in website loading time increases conversion by 2%. If your site visitor stays longer, they are more likely to convert.
A conversion happens when a visitor takes an action that benefits your business, such as purchasing a product, filling out a registration form, or subscribing to a newsletter. Conversion furthers visitors down the marketing funnel, leading to potential sales.
Brand Image
Your web performance helps establish your brand image. A well-performing website will leave a good impression on visitors, improving your brand reputation.
Visitors may question your business’s legitimacy if the site loads very slowly. It may also suggest that your business is unreliable and incompetent. This can damage your brand image, turn potential customers away, and ultimately harm your business.
Meanwhile, a well-received brand image helps strengthen your online presence. It is vital to keep you competitive in the online market.
Mobile Experience
A study shows that 92.1% of users access the internet using their mobile devices. This makes developing a mobile-friendly website essential for any site owner.
Making a mobile-friendly website isn’t only adjusting the website’s layout for mobile use. You must also consider how fast mobile devices load your website.
Due to less powerful hardware, mobile devices load average web pages nearly 90% slower than desktop computers. Enhance your website for mobile use to ensure it performs well across all devices.
SEO
Your website’s performance affects search engine optimization (SEO) because loading speed is a Google ranking factor. If your website loads quickly, it can rank higher on Google.
If you have a slow website, visitors may leave your site immediately. This increases the bounce rate and lowers dwell time, indirectly impacting your site’s ranking on different search engines.
Pro Tip
Struggling with your website performance? It might be time to consider switching to a new web host. Exploring your options could reveal that migration is easier and more beneficial than you think.
What Factors Affect Website Performance?
A website comprises many metrics that can impact its performance. We will explain what they are and how to optimize them.
Page Weight
Also known as page size, this metric refers to a website’s total file size, including its scripts, HTML codes, images, and videos. Web browsers must download all these files to display a web page correctly.
A heavy site has many large-sized resource files that take longer to download. Therefore, page size directly affects your page speed.
There are various ways to lower your website’s file size:
- Simplify the website design. Use a clean and simple theme to minimize the amount of files visitors download when accessing your website.
- Minify code files. Remove unnecessary characters on your site’s code files by deleting white spaces, new lines, and comments.
- Remove custom fonts. One custom font is typically a few hundred kilobytes in size. Although seemingly insignificant, too many fonts take longer to load, especially for visitors with slow internet connections.
- Reduce ads. Loading ads take up additional resources. Therefore, don’t overdo it and display them only in relevant places.
Expert Tip
With best practices and enough resources, you can make websites with lots of content lightweight. Heavy websites can load efficiently if you use a good caching solution, a CDN, image optimization, and a sufficient hosting plan with enough CPU, RAM, and I/O.

Images
Image files can significantly impact site performance. They are much larger in size than other files like HTTPS texts, making them slower to load.
But since images are essential for many websites, removing them to improve loading speed is not viable. Thankfully, you can optimize images to create a similar effect. Here are some image optimization options:
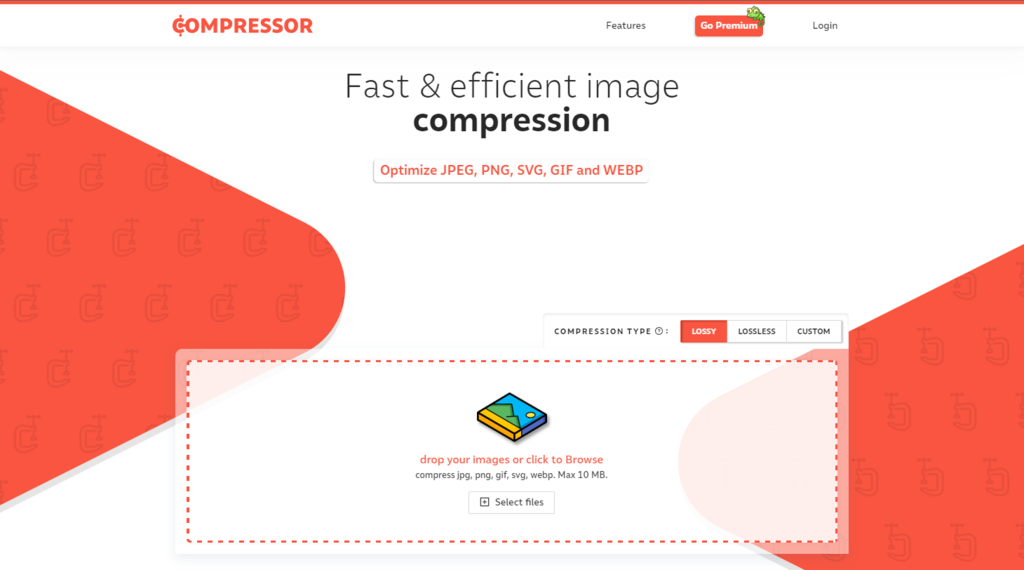
- Compress your image. Reduce image size using compression websites like Compressor.io. Experiment with different settings to find the right balance between quality and size.
- Keep image files to a minimum. Avoid putting too many images on your site. Only choose images that are necessary and put them where relevant.
- Resize images. Change your images’ dimensions according to their containers. Using overly high-resolution images provides no benefits and instead slows down your site.
- Replace images with CSS sprites. CSS sprites are collections of images in a single file. Sprites reduce the number of visual resources, boosting your page speed. To create CSS sprites, use Toptal’s CSS sprites generator.
- HTTP Requests
Whenever a user visits a web page, their browser sends an HTTP request to the target server. This HTTP request specifies what the browser needs to display the web page.
In return, the website’s server sends a response with the requested files. Once it delivers all the resources, the browser can display the web page fully.
If the site has many files, the browser will send more requests. This extended data transfer process may lead to a slower site speed.
Simplifying your site reduces the number of resources, resulting in fewer HTTP requests. Including a Keep-Alive code line on HTTP headers also makes data transmission more efficient.
Moreover, avoid using elements from third-party resources, such as YouTube videos. Displaying them requires fetching additional resources from the third-party source, lengthening the overall process.
Browser Caching
After opening a website, browsers temporarily store its data as a cache. Website cache includes files for displaying the page, like HTML codes and images.
The purpose of caching a website is to speed up load time upon revisits. Since web browsers store cache locally, they don’t have to re-fetch site resources from the servers.
Depending on your web hosting provider, the steps to enable cache may differ. Usually, you can activate it through the web hosting control panel.
Alternatively, activate caching by editing the .htaccess file. For WordPress websites, use plugins such as W3 Total Cache and LiteSpeed.
File Compression
Transferring smaller website files is quicker as they require less bandwidth. Therefore, compressing large files helps improve page speed.
Compression lets servers shrink site files before sending them to web browsers. Compressed files can be up to 70% smaller than normal ones, allowing web browsers to load them more quickly.
To enable compression, use tools like GNU Gzip. This popular compression software supports multiple file extensions, including HTML, CSS, and JavaScript.
Render-Blocking CSS and JavaScript
Whenever a web browser loads a site, it will prioritize CSS and JavaScript and pause HTML parsing. These codes will load before the essential elements, making the website appear slower.
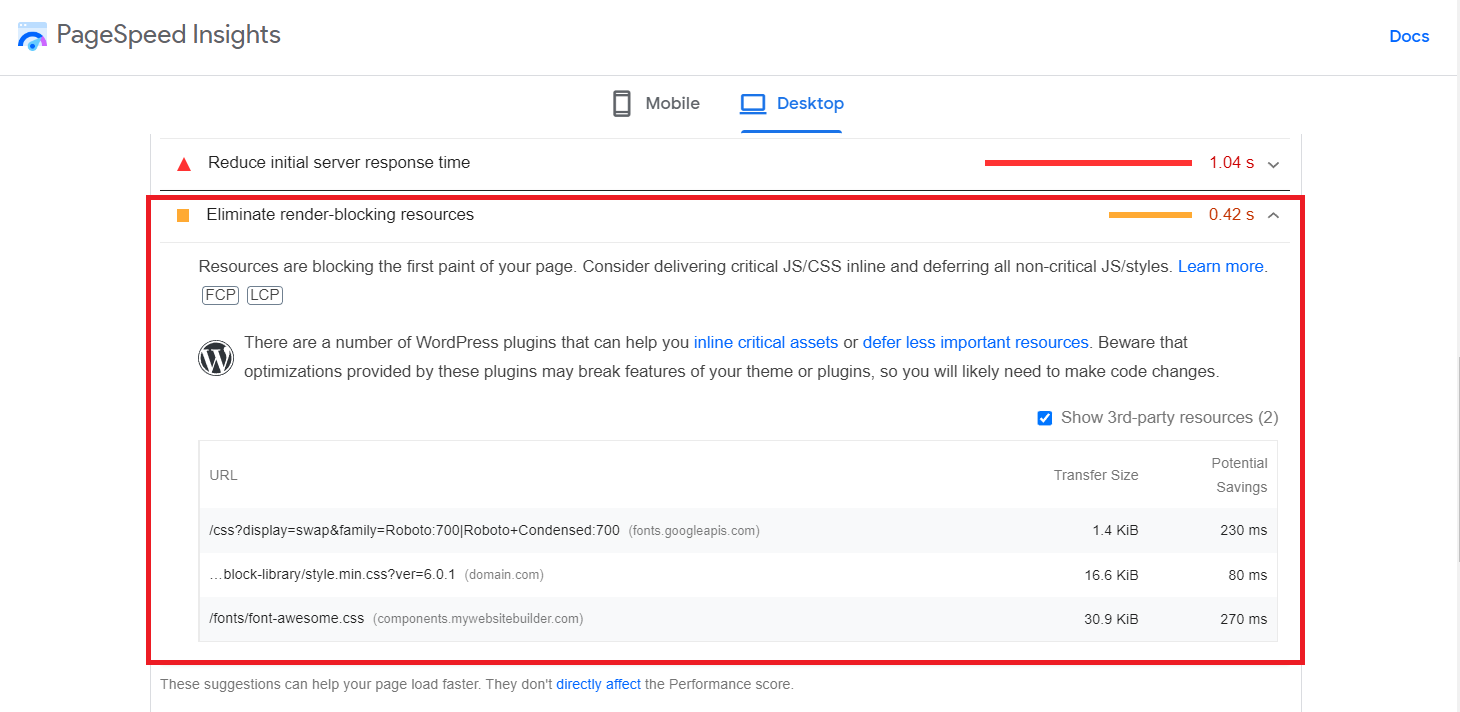
Render-blocking code may not be necessary for first-hand user experience. Therefore, developers usually delay or eliminate unnecessary CSS and JavaScript codes.
For WordPress websites, remove unused plugins and themes to fix this issue. Plugins and themes add additional CSS and JavaScript to the front-end.
Hosting
Choosing the right web hosting provider is crucial for your site’s performance. An unreliable hosting service may slow down your site or hurt your website uptime.
Before subscribing, consider the host server’s hardware to ensure its reliability. Look for a hosting service with solid-state drives (SSDs), high-capacity random access memory (RAM), and high bandwidth connection.
You should also pick a hosting service that matches your needs. For a high-traffic website, avoid shared hosting and opt for cloud web server or VPS instead. A shared hosting plan splits the server’s resources for multiple users, slowing down your site during request spikes.

Hosting Location
Your website is stored on a server in a specific location. To display the website, the host server will send the resources to browsers around the globe via physical undersea internet cables.
The further away from the server, the longer the path for the data to travel. Your website resources will take longer to send and load, resulting in a slower loading speed.
One solution is to use a Content Delivery Network (CDN) service, such as Cloudflare. A CDN is a group of servers spread globally that store a copy of your site files.
So when someone accesses your website, the CDN will deliver your site’s resources from the server closest to the user. This shortens the distance, improves delivery speed, and reduces bandwidth consumption.
Permanent Redirects
A permanent redirect transfers a user from the site they access to another. Its purpose is to ensure visitors land on the newer website instead of the unused, old one.
When accessing a website with a permanent redirect, the browser will send the same request twice. It will load the original site first and redo the process for the correct site.
Permanent redirects cause an additional transmission between the server and web browser. This costs extra time, which may harm your web performance.
Network Conditions
Among other factors, network condition is one of the most fundamental. Errors with the network can occur on the client or server side.
If the network is unstable, the communication between the servers and visitors’ web browsers stalls. This can slow down your page even if it’s well-optimized.
Website Performance Metrics
Web developers use various metrics to measure performance. Understanding these crucial metrics can help you determine which areas need improvements.
Page Load Time
Page load time refers to the time it takes for a browser to load a website fully. It is measured from when the user enters a URL or clicks a link until the page finishes loading.
The ideal website page load time is under three seconds. However, this standard may not represent real-world loading time since device specifications, and network conditions vary.
Time to First Byte
Time to first byte (TTFB) is the time it takes for a web browser to receive the first byte of information after sending a request. This important metric is measured in milliseconds.
High TTFB means your web server is unresponsive and may be facing an issue.
Time to Start Render
Also known as Start Render Time (SRT), Time to Start Render (TTSR) measures how long it takes for the first website element to load. This can be any element, regardless of its size and importance.
Low TTSR means the visitor can quickly see the website’s content. It signals to them that the website is being loaded, which keeps their attention and prevents them from clicking away. As such, TTSR is an important metric to retain visitors.
Time to Title
Time to Title is the time it takes for a website’s title to display on the browser tab. The longer it takes for the site title to appear, the more likely visitors will leave.
An optimal Time to Title convinces visitors about your site’s legitimacy. It also lets visitors quickly determine whether the website’s content will fulfill their expectations.
DNS Lookup Speed
Domain name system (DNS) lookup speed measures how quickly DNS servers resolve the queried domain name to the respective IP address. Your site only loads after the DNS servers give your web browser the correct IP address.
The average DNS lookup speed is 20 to 120 milliseconds. If the DNS lookup takes more than 120 milliseconds, it can impact your website’s performance.
There are various methods to reduce DNS lookups. The most common way is to switch to a fast DNS service provider.
Time to Interact
Time to Interact (TTI) is the time a website takes until the user can interact with it. This is an essential metric since some websites may finish loading all contents but remain non-interactable.
According to PageSpeed Insights, a website is fully interactive when:
- The page reveals useful content calculated by First Contentful Paint (FCP).
- Event handlers are registered for most of the site’s visible elements.
- The website responds within 50 milliseconds.
Optimizing TTI improves user experience by ensuring visitors can interact with the page as quickly as possible.
Bounce Rate
Bounce rate is the percentage of visitors that immediately leave a site without taking any action. If your website has a high bounce rate, it may be because your site is slow.
However, other factors can affect bounce rates aside from slow loading speed. Even if your site loads instantly, visitors may leave immediately if they don’t find its content engaging.
Conversion Rate
Conversion rate is the proportion of converting users to total visitors. It doesn’t directly indicate your web performance like other metrics, but it can be an indicator.
A high conversion rate suggests that your website satisfies visitors to a degree. This means your site performs well and gives a positive impression on visitors, encouraging them to convert.
Error Rate
The error rate is the number of problematic requests relative to the total requests over a certain period. A high error rate suggests that the web server often encounters issues that prevent the site from loading properly.
This metric lets you diagnose when your site encounters errors, for example, during traffic spikes. This will help you accurately pinpoint the problem and fix it.
Requests per Second
Requests per second (RPS) is how many requests a web server receives in a second. Requests include all interactions with the web server, such as fetching emails and database queries.
RPS indicates web servers’ capability to handle requests. RPS testing gives insights into how your site would perform under high traffic.
Your site will slow down if the RPS exceeds the server’s capacity. To improve your site’s RPS load, switch to a more reliable web hosting provider.
How to Monitor Site Performance
The most common way to do a website performance analysis is to test its loading speed. First, finding out how to analyze website performance helps you find problems and areas for improvement.
When monitoring performance, use tools for better insight into your site. There are various website speed test tools available with different features and prices, such as:
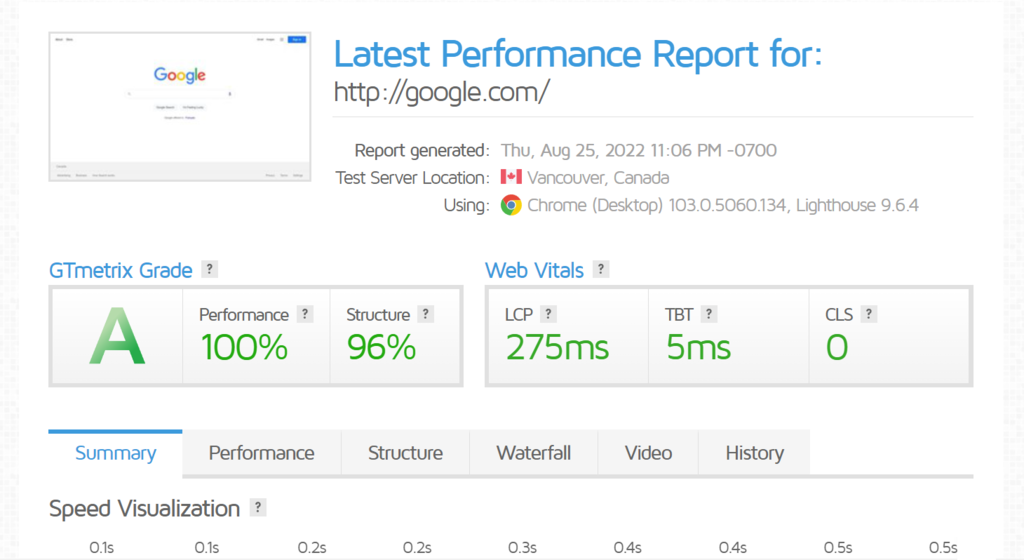
- GTMetrix. A freemium tool with plenty of features. Aside from the basic website speed test, it offers monitoring and testing from different locations. Its premium plan starts at $10.67/month.
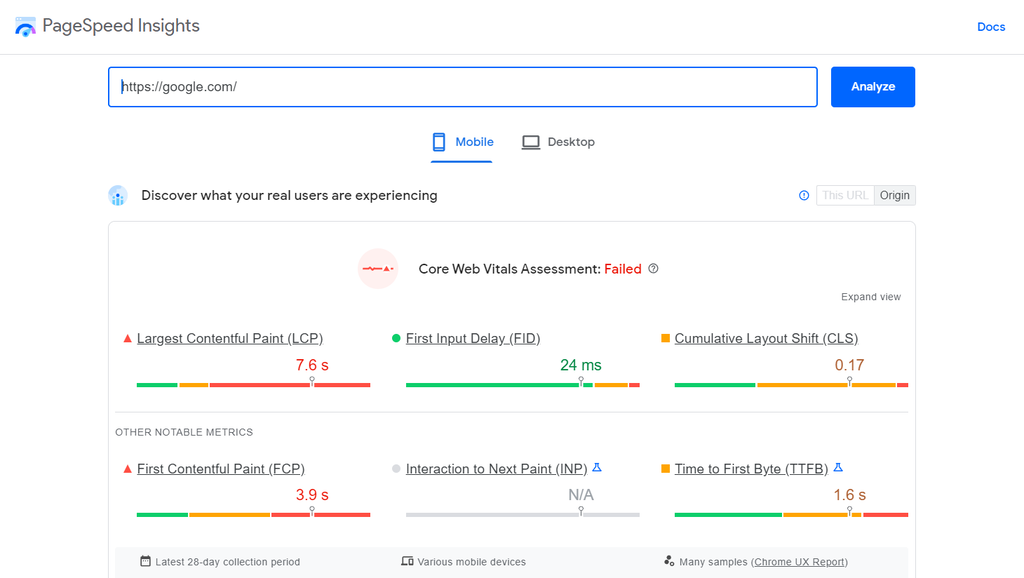
- Google PageSpeed Insights. This tool comprehensively analyzes different website performance metrics and diagnoses issues. Best of all, Google PageSpeed Insights is completely free.
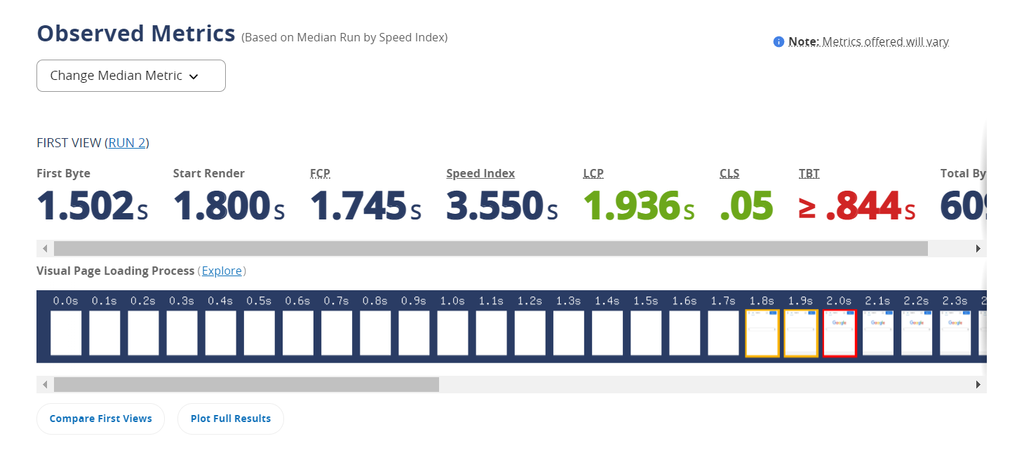
- WebPageTest. This open-source tool provides a detailed performance summary and supports multi-location testing. However, WebPageTest’s user interface may be too complicated for beginners. It’s a freemium tool with premium plans starting at $15/month.
After optimizing, regularly monitor your website to ensure it performs consistently over time. Monitoring also helps anticipate potential issues, allowing you to fix them as soon as possible.
There are two types of web performance monitoring – real user and synthetic monitoring.
Real user monitoring tracks actual users’ activities and provides a report on how your website performs to actual visitors. Meanwhile, synthetic monitoring simulates visitors’ activities, making it ideal for testing changes before applying them to the live site.
Some of the most popular user monitoring tools include:
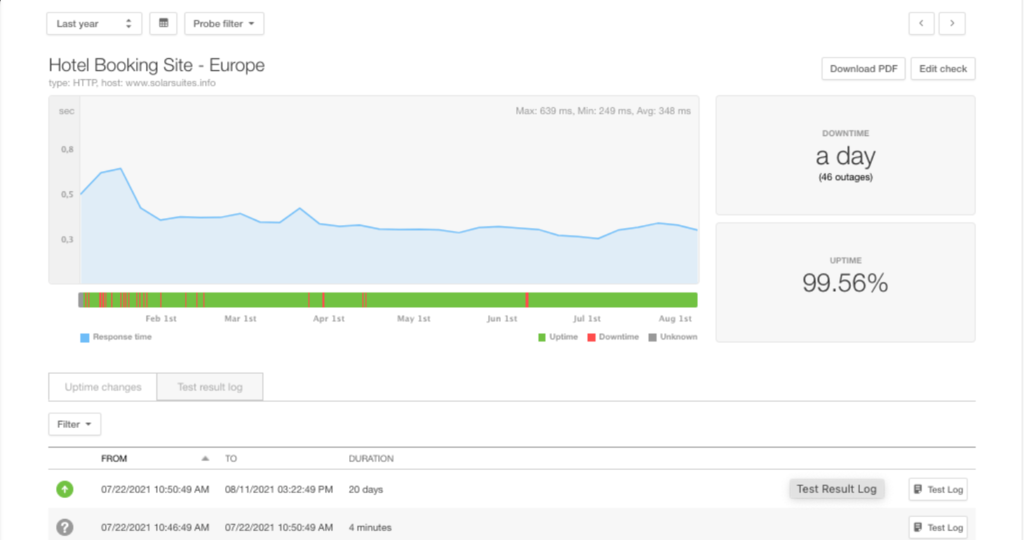
- Pingdom. This tool offers synthetic and real user monitoring. It provides a detailed breakdown of your website’s performance and notifies you immediately when an issue occurs. This premium tool starts at $10/month.
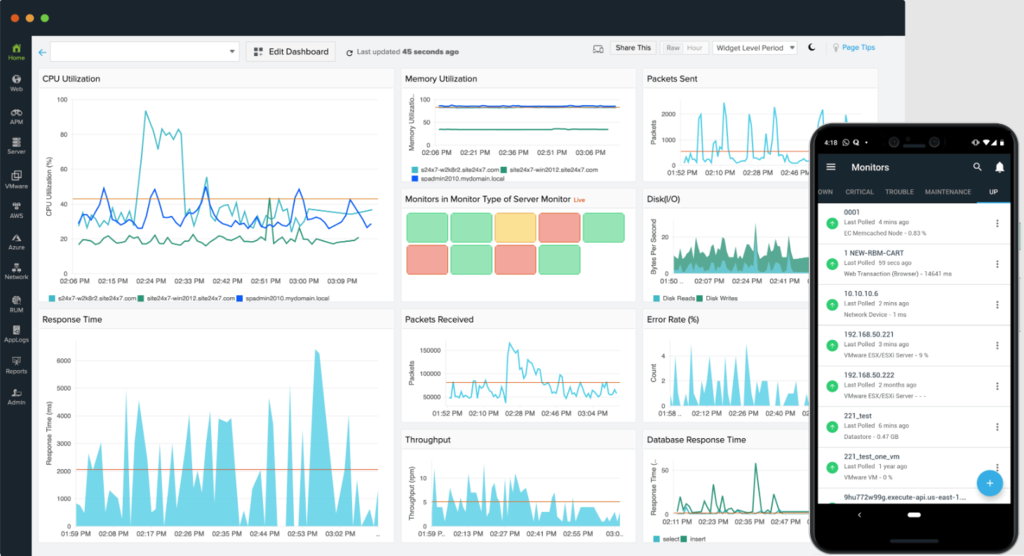
- Site24x7. An all-in-one solution for site monitoring. This tool includes real user, synthetic, application performance, and server monitoring. Site24x7 monitoring feature starts at $9/month, while the all-in-one plan starts at $35/month.
- TeamViewer. This tool lets you test your website’s speed from multiple global locations. TeamViewer is easy to use thanks to its user-friendly interface and visual performance report. Its web monitoring basic plan starts at $10.90/month.
Consider these tips when monitoring web performance:
- Aim for the best possible performance score on the analytics tool. However, not getting a perfect score doesn’t mean your site’s overall performance is poor.
- The test result doesn’t always represent the real-life website speed. There are various external factors, such as visitors’ device capability and internet connection speed.
- Use multiple tools and run the test numerous times. This allows you to compare different results and get an average number, resulting in a more accurate analysis.
- Conduct the test with different host locations. This way, you know your site’s performance across different regions without CDN.
Conclusion
Website performance refers to how quickly a website loads on a browser. Optimal performance is key to a successful website that benefits your business.
Visitors avoid poorly performing websites due to bad user experience. Slow page speed also damages your site’s search engine ranking and brand reputation.
Optimizing your website performance is not only about making your site fast. It can also improve your business’s online presence and nurture visitors into customers.
To boost your website performance, improve all affecting factors, such as page size, images, and hosting services. Additionally, understanding performance metrics lets you create a better website optimization strategy.
Website Performance FAQ
In this section, we will answer commonly asked questions about website performance. If your questions remain unanswered, feel free to leave them in the comments section.
What Is a Good Website Performance?
A well-performing website loads in under three seconds.
To see if your website performs well, do a speed test with tools like Google PageSpeed insights. The test result will show your website’s overall performance based on various important metrics.
What Makes a Website High Performance?
Many factors can improve your website’s performance, including light page weight, optimized images, minimal HTTP requests, and small-sized codes.
Removing render-blocking CSS and JavaScript, enabling caching, and using reliable CDN can also further boost your page’s performance.

Aris is a Content Writer specializing in Linux and WordPress development. He has a passion for networking, front-end web development, and server administration. By combining his IT and writing experience, Aris creates content that helps people easily understand complex technical topics to start their online journey. Follow him on LinkedIn.